
Data Engineering | Topics
dbt tutorial: analytics engineering made easy Henk Griffioen 12 Feb, 2020


When the number of pipelines that your data team develops and supports start to grow, you usually start encountering all sorts of problems, for example:
This and many others are common problems that we see when data platforms start to scale. In the cloud era, you won’t find limitations in storage or compute, but if you don’t use the right tools, things can get out of hand quite quickly. In this article, I will show you how you can better manage your data at scale using tools like dbt and Soda.
Like to see a live demo of the two tools combined? Then check out my talk together with my colleague Jovan at ClubCloud 2021:
I would say that in you work in data dbt almost doesn’t need an introduction. It has become the go-to tool for ELT (Extract, Load & Transform) architectures. In my view dbt is the perfect lightweight solution to manage your transformations within the warehouse/lakehouse. It is also one of the greatest open source communities in data (if not the best). This is quite a powerful thing, since it really allows the community to help shape the tool, which is one of the reasons why it evolves so fast and produces so many great features, such as:
Soda is a bit newer to the block. It is one of these up-and-coming tools trying to conquer the data monitoring space. I like that Soda has a simplistic approach to data monitoring, it tries to get the basics right: data testing and metric calculation in Soda SQL and a nice UI to monitor your data with Soda Cloud.
Soda’s proposition orbits around the two main products mentioned above, Soda SQL and Soda Cloud. Soda SQL is an open source tool that allows you to run scans on top of your data warehouse/lakehouse. Scans are basically a combination of two things: metric calculation and tests (using those metrics). Some nice features of Soda SQL are:
Soda Cloud is Soda SQL’s big brother. You can directly establish a connection to, let’s say, a BigQuery dataset from Soda Cloud, but I like to define my scans separately using Soda SQL to keep everything as code and version controlled. You can easily hook in your Soda Cloud API credentials on the warehouse.yml files needed to run Soda scans (see these docs for more info). Some nice features of Soda Cloud are:
Let’s go back go back to the second part of this blog’s post title, manage data at scale. When the amount of use cases grows, so does the amount of tables in your warehouse. There’s two things that can quickly become painful at this point: operations and data quality assurance.
Operations is concerned with the daily run of your pipelines, things like:
This is what dbt really excels at, making the development of data pipelines easy but the maintenance even easier. In the demo that Jovan and I made, we gave the example of backfilling data in incrementally loaded tables (i.e. incremental models for the dbters). Just by including a simple jinja statement in the where clause of your dbt models,
where true
{% if var.has_var('date') %}
    and date(created_timestamp) = date('{{ var("date") }}')
{% else %}
    {% if is_incremental() %}
        and date(created_timestamp) = date_sub(current_day(), interval 1 day)
    {% else %}
         and date(created_timestamp) < date_sub(current_day(), interval 1 day)
    {% endif %}
{% endif %}
dbt will flawlesly backfill data for that particular day and source table just by running:
dbt run --vars '{date: 2021-12-12}' --select some_staging_table+ In the code snippet we can see how, if the date variable is provided, we accommodate the filter to load data from that particular date into our incremental model. If the variable is not provided, then the regular incremental load is performed (usually the previous day if working with daily batches). This logic can also be modified to be able to backfill intervals of data by providing a start and end date plus slightly modifying the jinja logic. You can find more information about incremental models here.
Some people reading this article may think: "why do I need to use Soda if I can run tests with dbt?". That is a fair point, you can run tests with dbt and it is easy and convenient to do this in the same place where your data pipeline code lives. However, dbt is not a data monitoring tool. Therefore, it lacks some key monitoring features, such as: storing test results, detecting data drifts, identifying silent data issues and alerting.
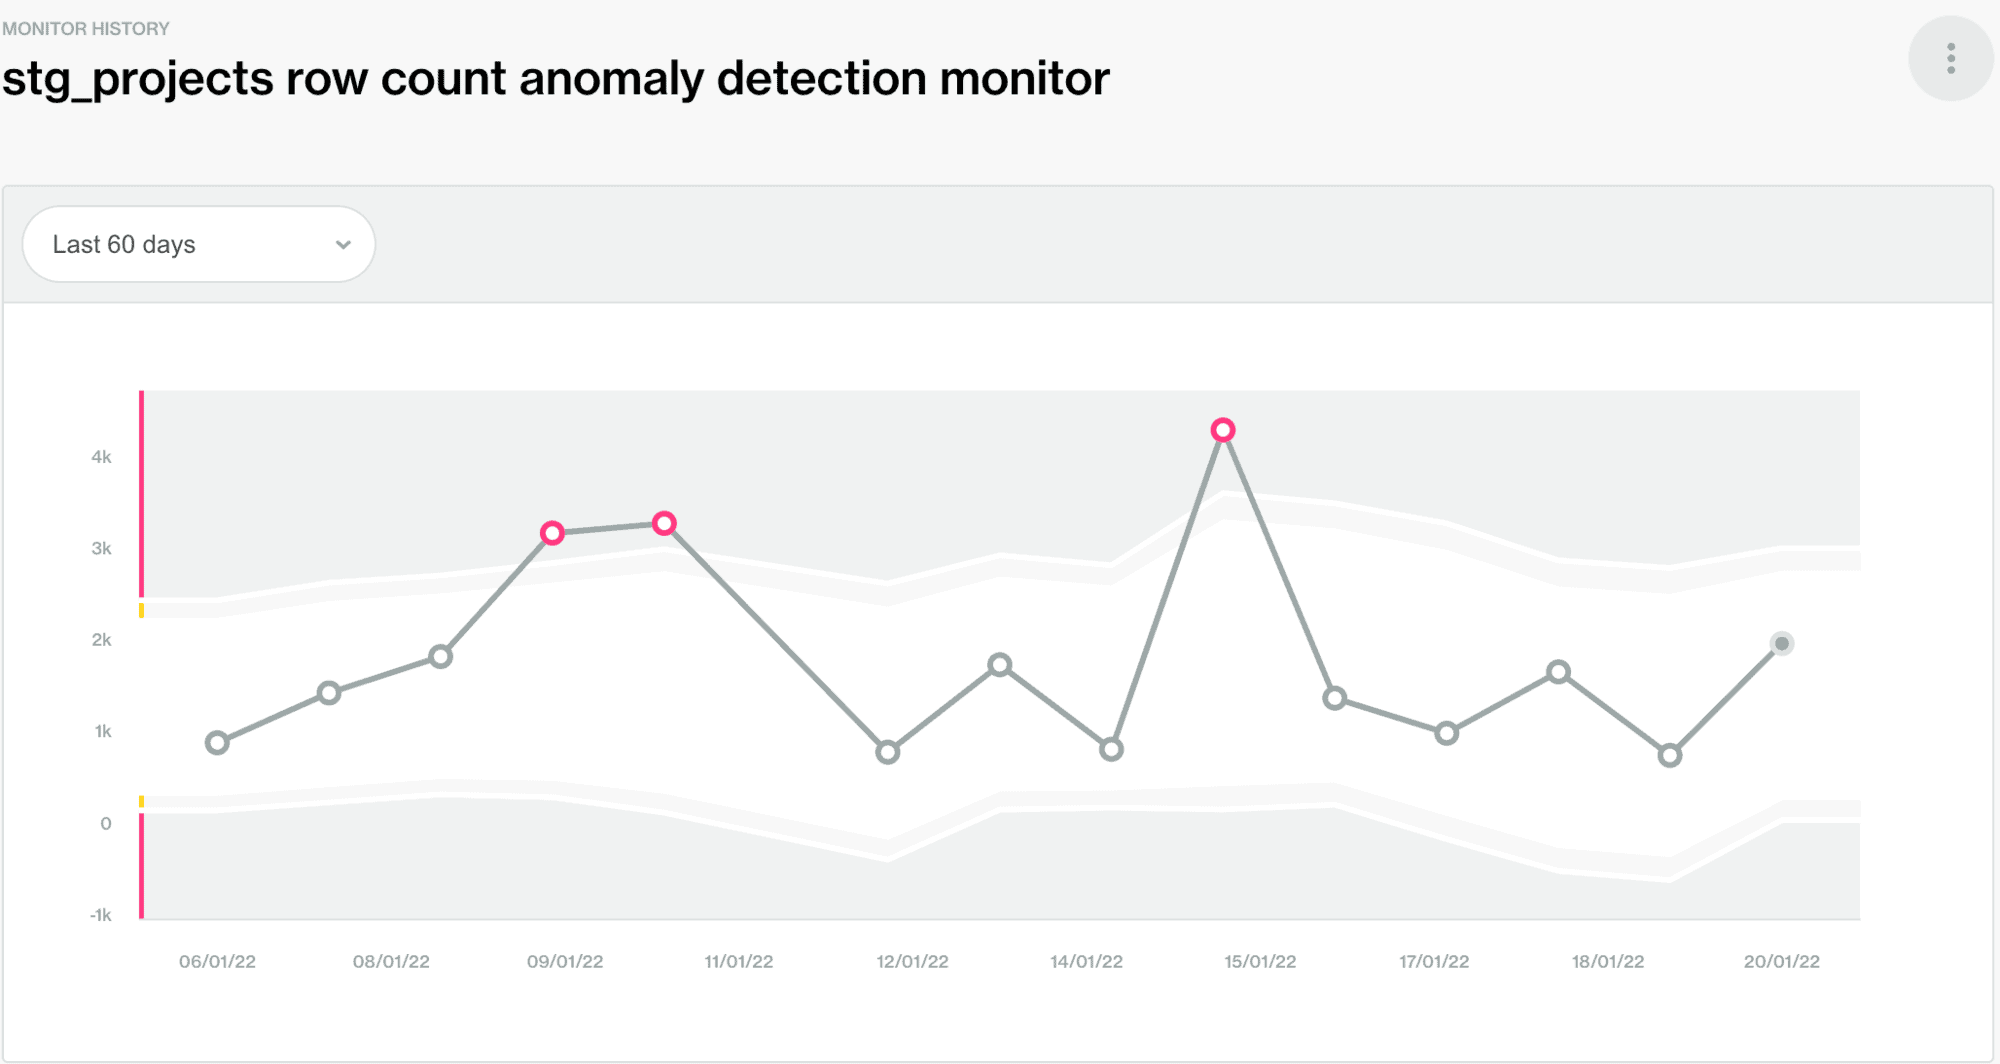
In the demo, we showed how convenient soda is for detecting silent data issues and alerting you on those. Common silent data issues are metric anomalies or schema drift (i.e. new columns being added or removed). The following screenshot is an example of anomaly detection on row count. This can be particularly useful when late facts arrive (row count is lower than usually) or duplicated records arrive and our tests do not catch this issue (maybe due to duplicated files with different names).
A simple yaml scan configuration like the following would ensure that duplicates are checked, the row count metric is calculated and that this is done on a daily basis (via the filter key). The anomaly detection monitor on row count is enabled by default when pushing the metadata results for the first time to Soda Cloud.
table_name: stg_projects
filter: "DATE(created_timestamp) = DATE_SUB(PARSE_DATE('%d-%m-%Y', '{{ date }}'), INTERVAL 1 DAY)"
metrics:
  - row_count
metric_groups:
  - duplicates
samples:
  table_limit: 50
  failed_limit: 20
tests:
  - row_count > 0
columns:
  id:
    tests:
      - duplicate_count == 0
      - missing_count == 0
Having this file and a warehouse.yml file pointing to the right credentials (both for the warehouse and Soda Cloud), we can simply run the scan as follows:
soda scan warehouse.yml tables/scan.yml --variable date=2021-12-12*As a side note, you can also integrate the results of your dbt tests with Soda Cloud since recently an integration has been released by the Soda folks (check the docs).
We made the repository used in our demo public so that you can fork it and play around with dbt and soda! We used a Github Actions pipeline to orchestrate the dbt and Soda runs, but you could use tools built specifically to orchestrate data processing worflows like Airflow, Prefect or Dagster. In the README of the repository there’s a runbook with some instructions on how to set up your environment for a PoC or hackathon.
If you play around with the tools and are interested on how to deploy them in your data platform, please feel free to reach out to me for a chat!
