
Data | Data Science and AI | Software Development
Apache Spark 
Jan Toebes 03 Feb, 2015


How do you process images efficiently in Apache Spark?
If you read the Databricks documentation you’d be pressed to believe most preprocessing must be done outside of the Apache Spark ecosystem.
For example:
These approaches are not truly distributed, but is there a better way?
In this blog I will show you how to use the build-in image datasource.
Leveraging this data source, Apache Spark will process the images in a truly distributed manner.[1]
python -m venv /path/to/spark-image-processing
source /path/to/spark-image-processing/bin/activate
pip install pyspark pillow pandas pyarrow tensorflow jupyterlabI chose the imagenette2.tgz mentioned on https://registry.opendata.aws/fast-ai-imageclas/.
From those 13000+ images I randomly selected 75:
find ./imagenette2 -maxdepth 4 -type f |
    sort -R |
    head -75 |
xargs -I{} cp {} ./data/images/mixedpyspark --master "local[2]" --conf spark.executor.memory=4G --conf spark.driver.memory=2Gfrom typing import Iterator
from pyspark.sql import SparkSession
from pyspark.sql.functions import col, pandas_udf, PandasUDFType
from pyspark.sql.types import StructType, StructField, StringType, IntegerType, FloatType, ArrayType, BinaryType
from PIL import Image, ImageDraw
from tensorflow.keras.applications.resnet50 import ResNet50
import tensorflow as tf
import numpy as np
import pandas as pdimages_dir = "./data/images/mixed/"
image_df = spark.read.format("image").load(images_dir).filter("image.nChannels > 2 AND image.height < 1000")
image_df.select("image.origin", "image.height", "image.width", "image.mode", "image.nChannels").show(5, truncate=False)image_row = 40
spark_single_img = image_df.select("image").collect()[image_row]
(spark_single_img.image.origin, spark_single_img.image.mode, spark_single_img.image.nChannels )
mode = 'RGBA' if (spark_single_img.image.nChannels == 4) else 'RGB'
Image.frombytes(mode=mode, data=bytes(spark_single_img.image.data), size=[spark_single_img.image.width,spark_single_img.image.height]).show()As you can see the image has a bit of a blue touch to it that doesn’t seem right.
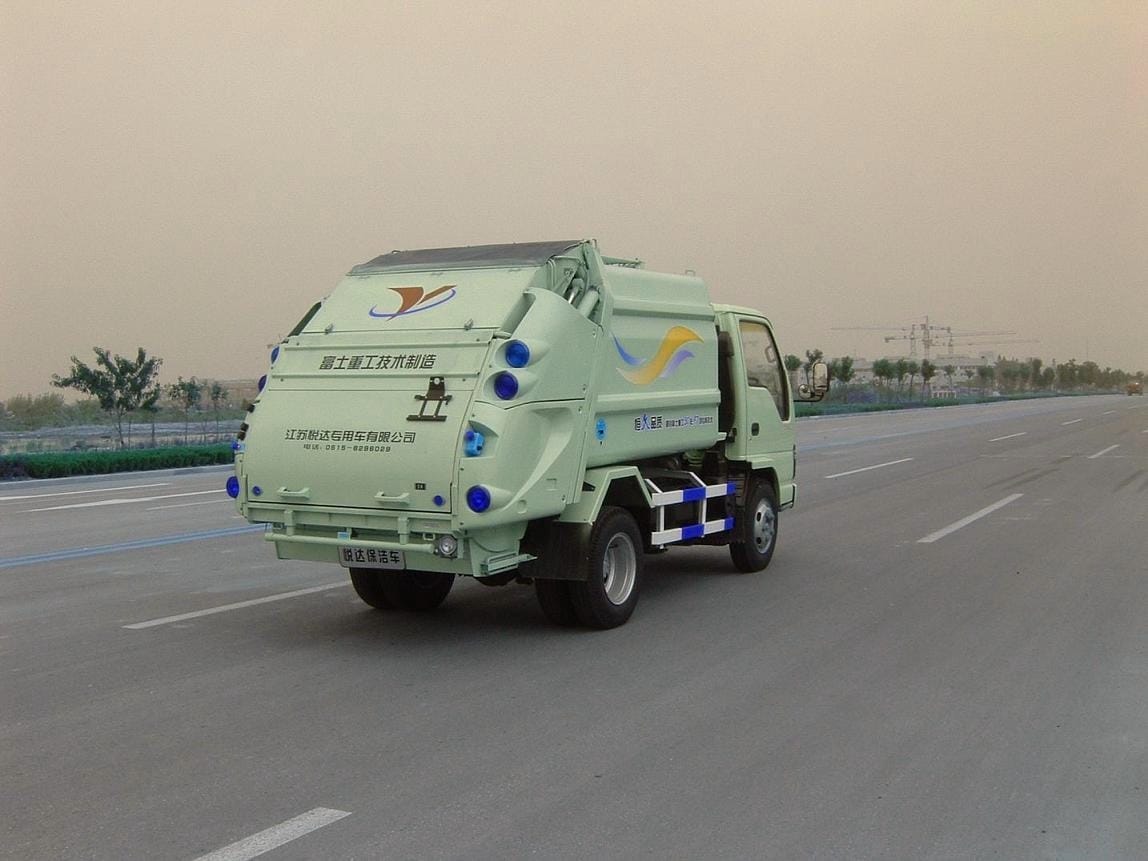

Why the extra blue in the artifact? The image datasource uses opencv to read the data. The library expects input as BGRA (Blue, Green, Red, Alpha) instead of RGB (Red, Green, Blue).
How to fix it?
def convert_bgr_array_to_rgb_array(img_array):
    B, G, R = img_array.T
    return np.array((R, G, B)).T

img = Image.frombytes(mode=mode, data=bytes(spark_single_img.image.data), size=[spark_single_img.image.width,spark_single_img.image.height])

converted_img_array = convert_bgr_array_to_rgb_array(np.asarray(img))
Image.fromarray(converted_img_array).show()
Better!
schema = StructType(image_df.select("image.*").schema.fields + [
    StructField("data_as_resized_array", ArrayType(IntegerType()), True),
    StructField("data_as_array", ArrayType(IntegerType()), True)
])

def resize_img(img_data, resize=True):
    mode = 'RGBA' if (img_data.nChannels == 4) else 'RGB'
    img = Image.frombytes(mode=mode, data=img_data.data, size=[img_data.width, img_data.height])
    img = img.convert('RGB') if (mode == 'RGBA') else img
    img = img.resize([224, 224], resample=Image.Resampling.BICUBIC) if (resize) else img
    arr = convert_bgr_array_to_rgb_array(np.asarray(img))
    arr = arr.reshape([224*224*3]) if (resize) else arr.reshape([img_data.width*img_data.height*3])

    return arr

def resize_image_udf(dataframe_batch_iterator: Iterator[pd.DataFrame]) -> Iterator[pd.DataFrame]:
    for dataframe_batch in dataframe_batch_iterator:
        dataframe_batch["data_as_resized_array"] = dataframe_batch.apply(resize_img, args=(True,), axis=1)
        dataframe_batch["data_as_array"] = dataframe_batch.apply(resize_img, args=(False,), axis=1)
        yield dataframe_batch

resized_df = image_df.select("image.*").mapInPandas(resize_image_udf, schema)
We can check if the data contains a converted and a resized image:
row = resized_df.collect()[image_row]

Image.frombytes(mode='RGB', data=bytes(row.data_as_array), size=[row.width,row.height]).show()

Image.frombytes(mode='RGB', data=bytes(row.data_as_resized_array), size=[224,224]).show()Right now we have a resized image, suitable to be used as input for the resnet50 classification model.
To build a predictive model we can use:
def normalize_array(arr):
    return tf.keras.applications.resnet50.preprocess_input(arr.reshape([224,224,3]))

@pandas_udf(ArrayType(FloatType()))
def predict_batch_udf(iterator: Iterator[pd.Series]) -> Iterator[pd.Series]:
    model = ResNet50()
    for input_array in iterator:
        normalized_input = np.stack(input_array.map(normalize_array))
        preds = model.predict(normalized_input)
        yield pd.Series(list(preds))

predicted_df = resized_df.withColumn("predictions", predict_batch_udf("data_as_resized_array"))
To check the prediction of our reference image
prediction_row = predicted_df.collect()[image_row]

tf.keras.applications.resnet50.decode_predictions(
    np.array(prediction_row.predictions).reshape(1,1000), top=5
)
That gives the following output:
[
  [
    (
      "n03417042",
      "garbage_truck",
      0.9919044375419617
    ),
    (
      "n02701002",
      "ambulance",
      0.004018119070678949
    ),
    (
      "n03769881",
      "minibus",
      0.0015384092694148421
    ),
    (
      "n03770679",
      "minivan",
      0.0005491302581503987
    ),
    (
      "n03977966",
      "police_van",
      0.00048319826601073146
    )
  ]
]
The model is confident the image represents a garbage truck — even though the goal of this post is not about creating a precise model but rather to outline how to process data in a distributed manner!
decoded_predictions_schema = StructType(predicted_df.schema.fields + [
    StructField("pred_id", ArrayType(StringType()), False),
    StructField("label", ArrayType(StringType()), False),
    StructField("score", ArrayType(FloatType()), False)
])

def top5_predictions(preds):
    return tf.keras.applications.resnet50.decode_predictions(
        np.array(preds).reshape(1,1000), top=5
    )

def top5predictions_batch_udf(iterator: Iterator[pd.DataFrame]) -> Iterator[pd.DataFrame]:
    for dataframe_batch in iterator:
        yield pd.merge(
            dataframe_batch,
            right=pd.concat([
                pd.DataFrame(top5, columns=["pred_id", "label", "score"]).aggregate(lambda x: [x.tolist()], axis=0) for [top5] in dataframe_batch.predictions.map(top5_predictions)
                ]).reset_index(drop=True),
            left_index=True,
            right_index=True
        )

top5_predictions_df = predicted_df.mapInPandas(top5predictions_batch_udf, decoded_predictions_schema)
We check the results on our reference image
top5_prediction = top5_predictions_df.collect()[image_row]
top5_prediction.label[0]  # gives garbage_truck
To visualize it we can add the label to the images
def show_image_with_label(image, label):
    draw = ImageDraw.Draw(image)
    draw.text((10, 10), label, fill="red")
    image.show()

show_image_with_label(Image.frombytes(mode='RGB', data=bytes(top5_prediction.data_as_array), size=[top5_prediction.width,top5_prediction.height]), top5_prediction.label[0])
Here is our image with the predicted label:
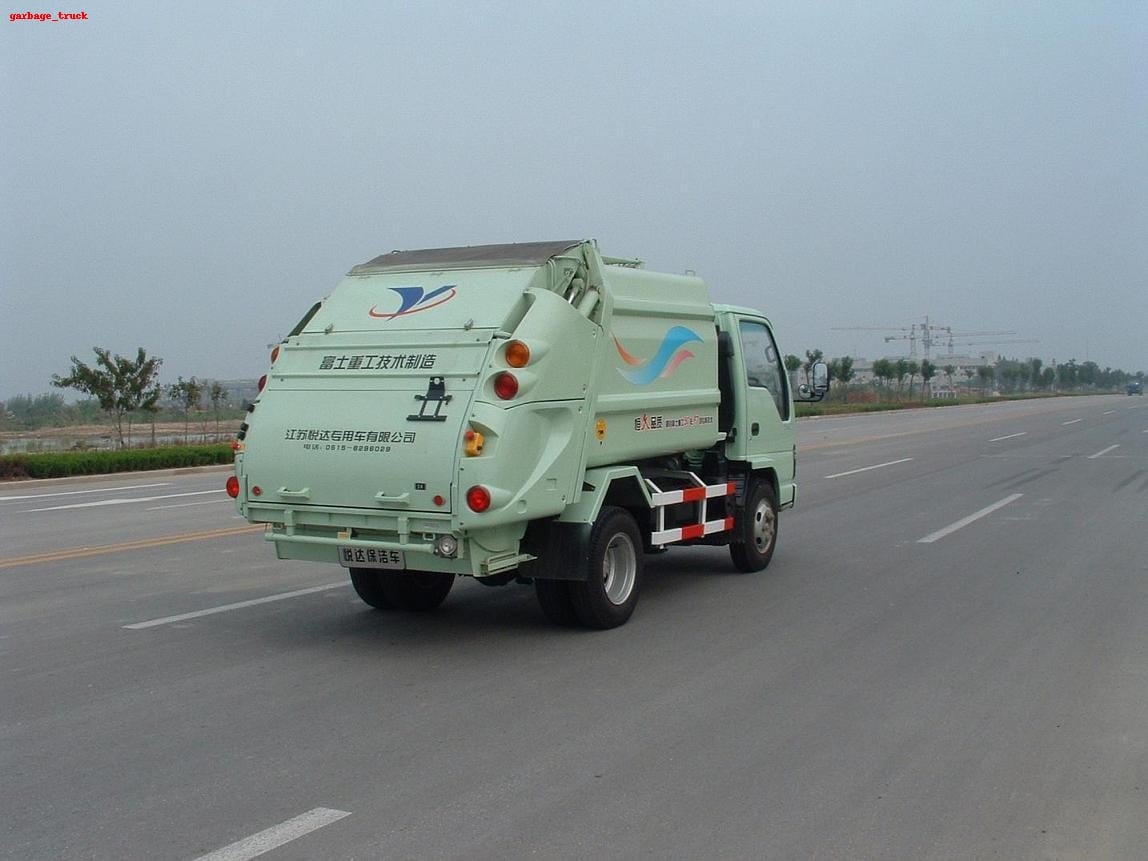 .
.
We can show them all with:
for row in top5_predictions_df.collect():
    show_image_with_label(Image.frombytes(mode='RGB', data=bytes(row.data_as_resized_array), size=[224,224]), row.label[0])
All the commands can be copy/pasted into your spark shell. For easier access I created a notebook with the same code to experiment further with.
That’s it for today! Remember;
[1]: The official image data source documentation states that there are some limitations of using this datasource type so be aware of that.
