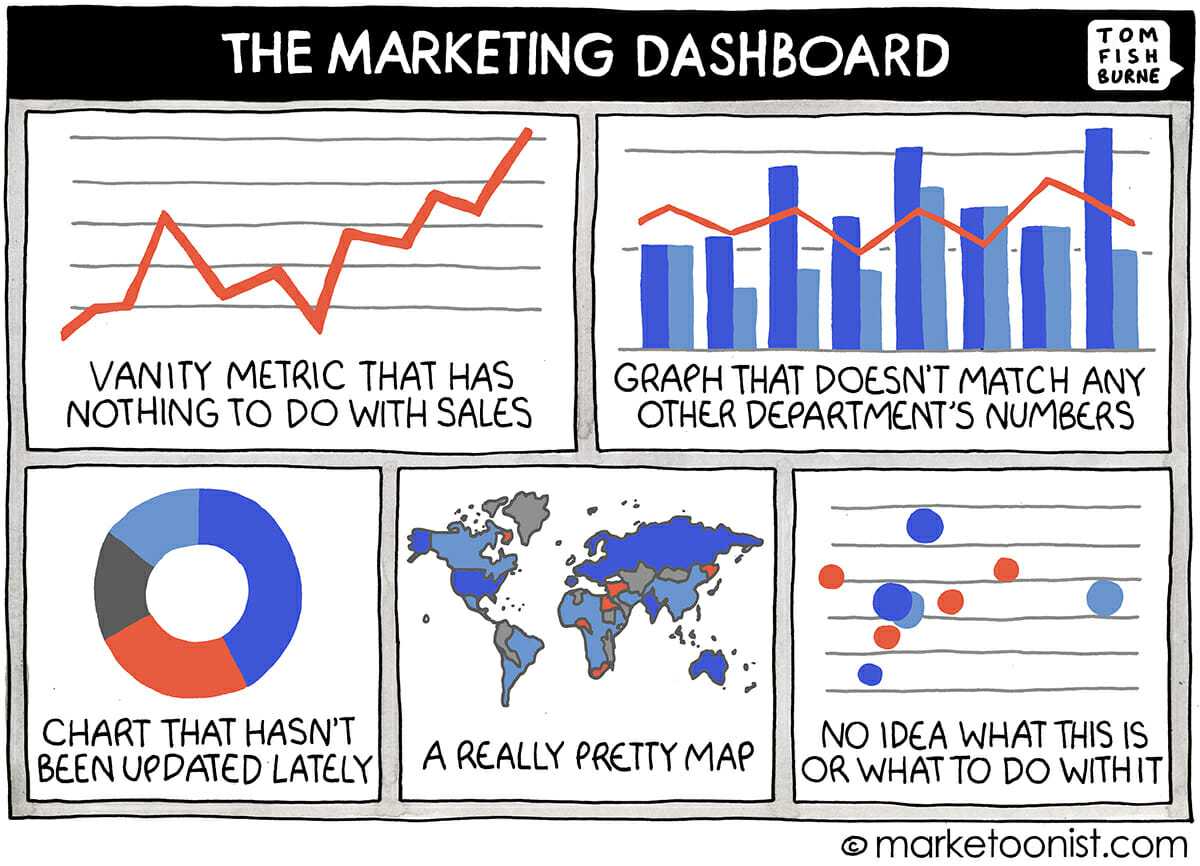
There is a plethora of resources teaching you how to create dashboards. How to choose the right colors, transform the data, choose the right graph for your data, and ten million use cases for each shiny feature in your BI tool of choice. But there are extraordinarily little frameworks on how to turn the creation of a dashboard into a business success.
In this series of articles, I won’t tell you how to create the world’s best dashboard. Instead, will walk you through the most common pitfalls that dashboard makers encounter. In this blog, we will discuss everything you should have ready before you start creating dashboards. In the coming articles, we will discuss other considerations during and after you finish your first dashboard.

Dashboarding as a project
Dashboarding is an interesting type of project. Generally speaking, it is the first project organizations undertake to prove the value of their data. In addition, most people severely underestimate the difficulty of making good dashboards. Consequently, many dashboards are built by inexperienced data professionals in organizations that struggle with many data maturity problems (e.g. lack of proper data architecture).
Regardless of the available data talent and maturity level in your organization, it is your responsibility as a project manager to give a realistic indication of the scope and time needed to complete a dashboard. Nobody wants to face your stakeholders with excuses, after telling them that it is just a matter of “putting a couple of graphs together.”
How long does it take to make a dashboard?
Under the right circumstances, a dashboard can be built in 3 days. On the first day, the dashboard maker understands the business objectives and gets familiar with the data. On the second day, one or many versions of the dashboards will be made. On the final day, you work on the feedback and deploy.
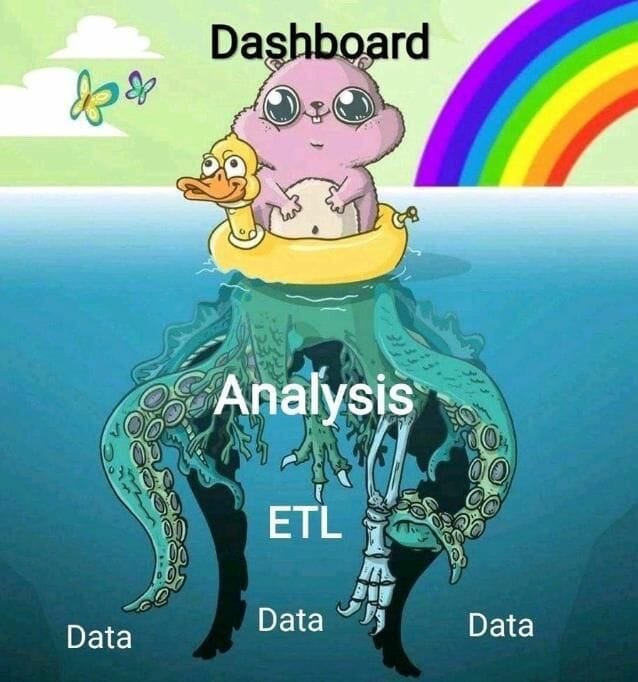
3 days is definitely feasible, but it is also too good to be true. In fact, it is also not uncommon to hear of dashboards that take months or years to be made. Changing a lightbulb only takes a few minutes. The problem with dashboarding is that you are often not only changing a lightbulb, but also installing the electric grid and sometimes building the house. In the case of dashboards, putting a couple of graphs together is not a big deal. Most of your time is spent making the data consumer-ready, writing business logic, and defining data governance by trial and error.
Clean data, robust data architecture, and data governance are pre-conditions to build a good dashboard. If you work in a more mature organization, all of these will be in place. Once the heavy lifting has been done, making a dashboard will take you 3 days. If your organization is just figuring out how to work with data (not a crime, we all start somewhere), here are some points you should assess carefully.

Scoping: Before
Executive support
Potentially, the most crucial factor is to ensure the support of your leaders. C-levels and everyone below needs to know the importance of data. The cherry on top is to work in an organization where everyone understands that being data driven is an ongoing effort that requires focus, workforce, and a budget.
If you are having trouble convincing your stakeholders, here is a handy tip. Most BI tools will be happy to help you build a use case and potentially organize a demo. It is in their best interest for you to adopt the tool.
Data architecture
Manually updating a dozen spreadsheets is error prone and cumbersome. In an ideal universe, you have a whole team ingesting, transforming, and making data available in a robust way. If your infrastructure is right, making a report should be as easy as connecting to a data platform and connecting to one of the many well-documented data products available.
If you don’t have enough IT resources for a data platform, most modern BI tools have their own way of hosting data. They often lack safety features like version control or automated data testing. Meaning that you should probably stick to tools like dbt to store your datasets. However, features like Power BI datasets or the Tableau data server might ease the transition while you are looking for a more permanent solution.
Cost estimations
How much will this cost us? Let me give you a clue, the cost of a license is a terrible proxy. Tools like Power BI or Tableau can look expensive due to their licensing cost, but the math changes once you consider that it is easier to find experienced professionals and that the development tends to be much faster than other alternatives.
As your user base grows and you want new features, your cost estimation will change. Tableau, for example, offers a data management add-on that costs approximately 60 dollars per year per license. Power BI, just to name another example, charges 85 dollars per day per core if you decide to scale up the size of your Power BI service instance. I am not saying that these features are bad or expensive. They are definitely worth every cent for some organizations. My point is that it is your job to estimate what will happen as the tool adoption grows and, more importantly, how much you will need to deliver a great proof of concept. Asking your stakeholders for a bigger budget might come as an unpleasant surprise, especially if your dashboards are not fully functional yet.
Your cost estimation should include:
- Cost of consultancy hours.
- Cost to train/hire developers and admins.
- Cost of infrastructure or cloud expenses.
- Add-ons.
- Cost to allow everybody to “see” the dashboards.

Conclusion
Dashboards are often the first project to prove the value of the data in your organization. Yet, managers and developers often underestimate the preconditions required to make a successful dashboard.
In this blog, we discuss how obtaining executive support, having a robust data architecture, and doing a proper price estimation can help kickstart the project.
Stay tuned for part 2! There we will discuss what to scope during and after the development of your first dashboards.
Want to know more straight away? Watch my entire talk during Club Cloud 2021 on Dashboarding
If you enjoyed this content and you want to know more, get in touch with us. At GoDataDriven, we can support all your data endeavors. From building a data platform to consultancy in areas like Strategy, Data Engineering, Analytics, and AI.


